PhenomeLab
PhenomeLab is a self-contained Windows, MacOS, and Linux desktop application that allows interaction with the Phenome Technologies' hardware ecosystem. Designed for daily use by facility staff and researchers, it provides a unified interface for live cabinet sensor monitoring, wheel activity visualization, feeder error reporting. The client software also allows integration to our cloud-based data platform, PhenomeStudio.
- Purpose
- Interaction with Phenome Technologies' hardware ecosystem
- Platform
- Windows, MacOS, Linux
- Current Version
- 0.5.0
- Connectivity
- Wired RS-485 hardware interface; REST API to a PhenomeStudio server
- Data Availability
- All data is stored as easily readable CSV files for downstream analysis.
Inside the Application
Every workflow from light scheduling to wheel activity analysis is accessible from a single, purpose-built interface.
Key Features
A single application that covers the full daily workflow, from live environment monitoring to feeding error triage and wheel activity analysis.
Real-Time Cabinet Monitoring
Live temperature, humidity, and light-level readings are displayed per cabinet with adjustable history. Readings are refreshed continuously via hardware polling.
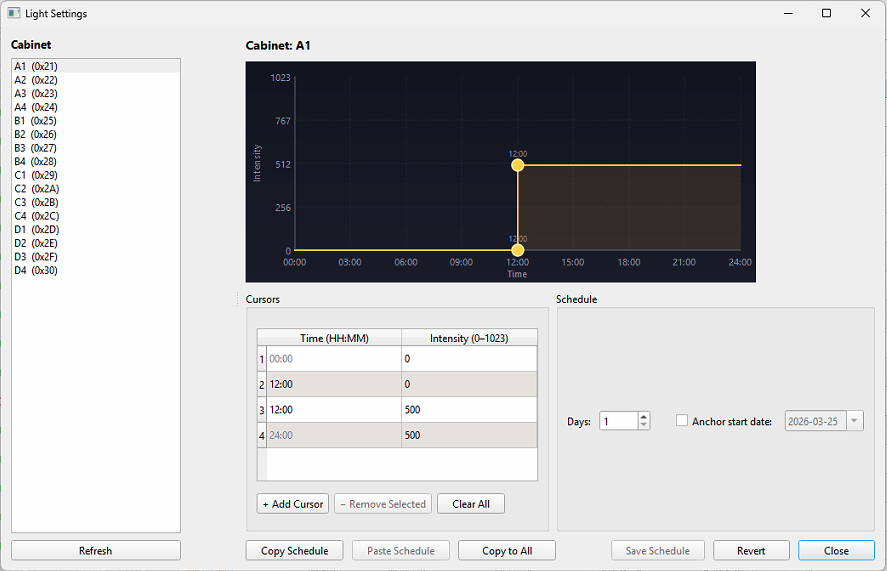
Light Scheduling
Easily configure and manage light schedules for each cabinet, ensuring optimal conditions for your experiments. Configure multi-day schedules or custom T-cycle and intensity settings.
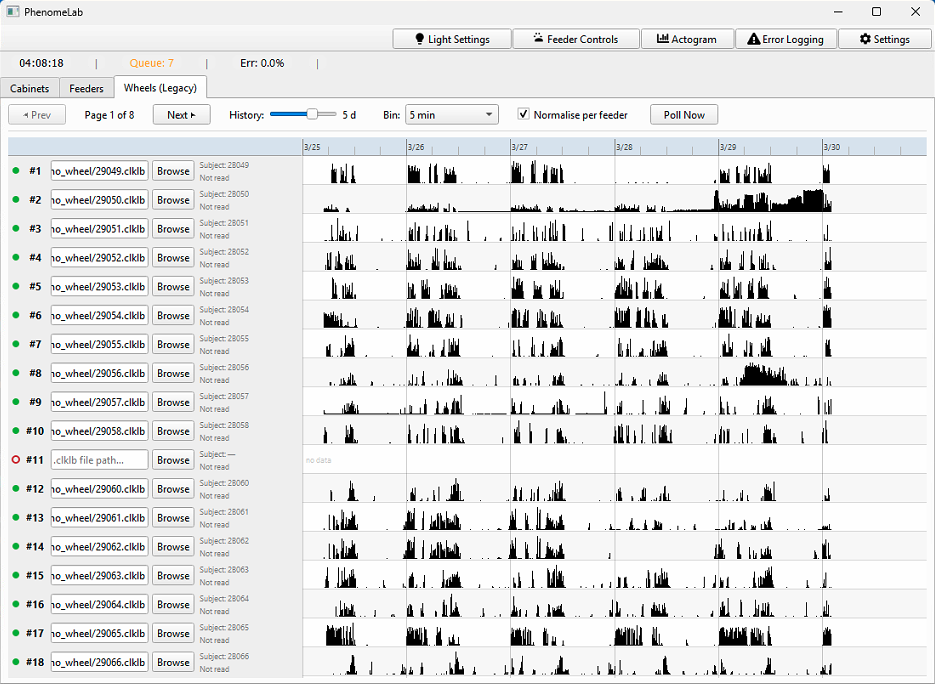
Wheel Activity Tracking & Actograms
Continuous wheel revolution data is collected from .clklb files and visualized per feeder with normalized or absolute activity bars. Full actogram history is loaded on demand for individual subjects, allowing you to quickly analyze activity patterns and trends.
Error Logging & Reporting
A dedicated Error Logging dialog alerts you to the most critical hardware and software issues. The filterable, read-only table can be copied directly to the clipboard for pasting into reports.
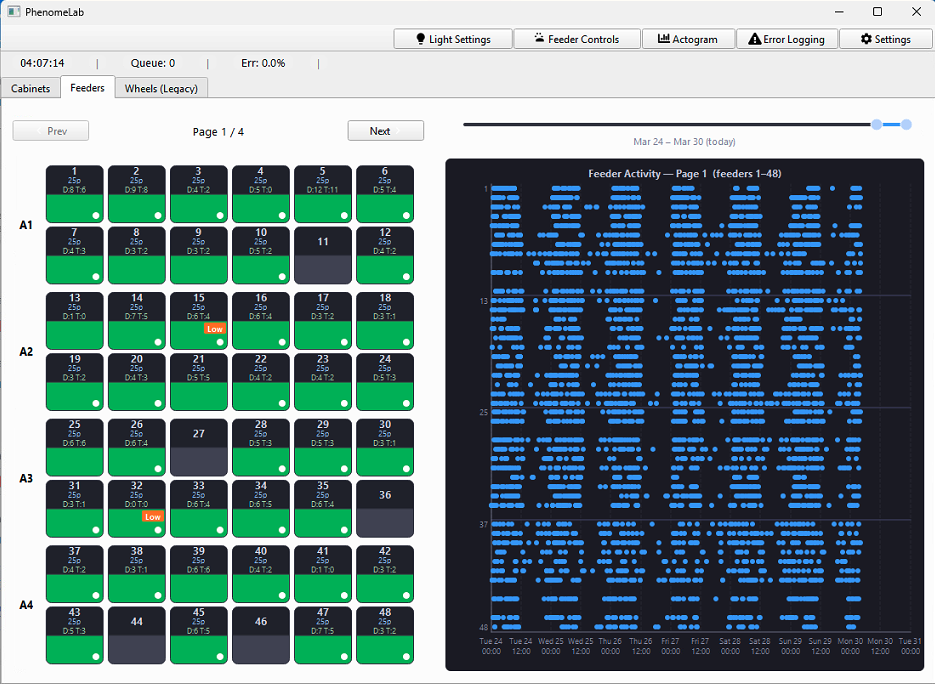
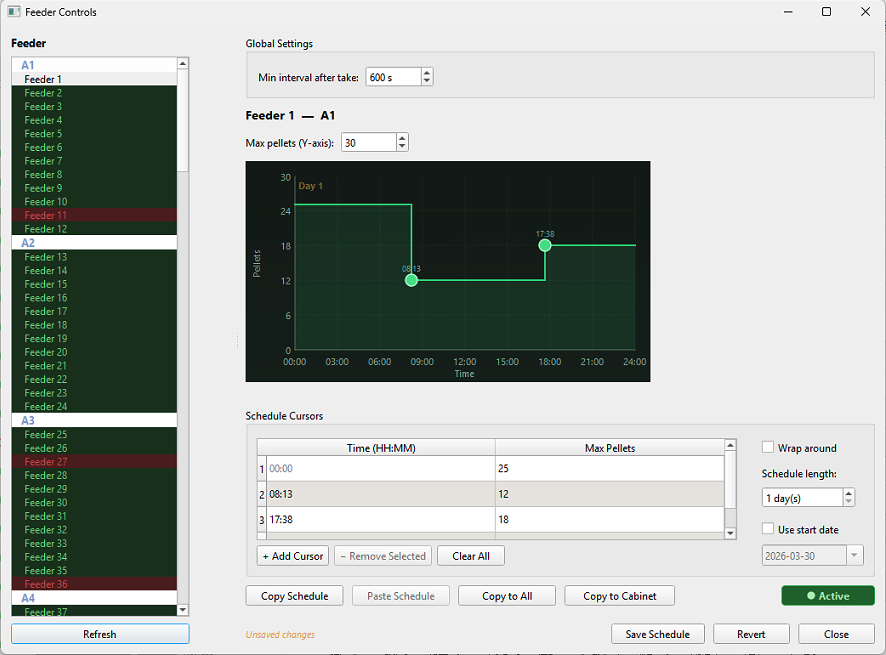
Feeder Management Dashboard
The Feeders tab displays a live grid of automated feeder status, with a longitudinal scatter plot showing feeding events across the full cabinet. Important information such as feeder connectivity, hardware issues, and recent activity is readily accessible.
PhenomeStudio Integration
Seamlessly integrates with our server-based monitoring platform, PhenomeStudio. Send cabinet sensor data, feeder data, and wheel activity data directly to PhenomeStudio, for centralized monitoring and analysis on an experiment-wide basis.
Zero-Dependency Deployment
PhenomeLab ships as a self-contained Windows executable, MacOS app or Linux App, with no Python runtime or installer dependencies. Drop it on any facility computer, activate the product either online or offline, and it runs immediately, with configuration persisted automatically between sessions.
Technical Specifications
| Platform | Windows (self-contained .exe; no Python installation required) |
|---|---|
| Current Version | 0.2.0 (released 27 March 2026) |
| UI Framework | PySide6 (Qt 6); packaged with PyInstaller |
| Hardware Connectivity | RS485 two-wire interface; compatible with all Phenome Technologies cabinets and feeders |
| Data Inputs | Live RS485 sensor polling; .clklb wheel activity files; batch CSV upload |
| Data Outputs | Data outputted in real-time to PhenomeStudio; supports CSV export for offline analysis |
| Persistent Configurations | Configurations, schedules and user preferences are persisted automatically between sessions |
| System Requirements | Windows 10 or later; network access to PhenomeStudio server |
Supported Research Applications
PhenomeLab is the operational hub for any facility running Phenome Technologies hardware, supporting continuous data collection across a range of in vivo research programs.
Circadian Rhythm Studies
Real-time light-level monitoring and actogram visualization give researchers immediate feedback on light schedule adherence and subject activity patterns across the full 24-hour cycle — without leaving the facility computer.
Metabolic & Feeding Research
The Feeders dashboard and error logging system provide continuous oversight of automated feeding schedules, with priority-based error triage and CSV export ensuring data integrity across long-duration metabolic studies.
Facility Management
Facility managers can monitor environment conditions across all cabinets simultaneously, receive structured error reports suitable for direct inclusion in study records, and push all data to PhenomeStudio for centralized archiving and analysis.
Ready to Discuss Your
Research Requirements?
Our team is available to provide full technical specifications, arrange a demonstration, and assist with custom configuration for your facility.